User’s manual
In this chapter:
Main window
Help
Creating records
Highlighting unread records
Deleting records
Bulk modifications
The Undo function
Working with hierarchies
Recent records
Related records
Record shortcuts
Quick search
Copying reports to clipboard
Printing
Logout
Let us assume that you opened an account in Instant Team service or installed Instant Team at your site and that the Instant Team administrator created a project management workgroup. Let us further assume you have installed an Instant Team client on your computer. Then you are free to start using Instant Team.
Instant Team is a so-called client/server application based on the Fat Client Technology.
On the one hand, this means that working with the application is very similar to working with common Windows applications and it is thus much more user friendly and comfortable than normal Internet applications. On the other hand, however, this means that we first need to install an Instant Team client on users’ computers.
The installation is performed by a self-installation file, which you can download at any time from the Instant Team service web pages. You will find detailed instructions in our confirmation of your registration.
Login
After launching the Instant Team client a login window comes up first. Here, you fill out your name and password that you chose when registering or perhaps that you were assigned by the administrator and press the Login button.
If you tick the Remember me on this computer checkbox then the next time you run the application on the same computer you will be automatically logged in with the user name and password you enter now.
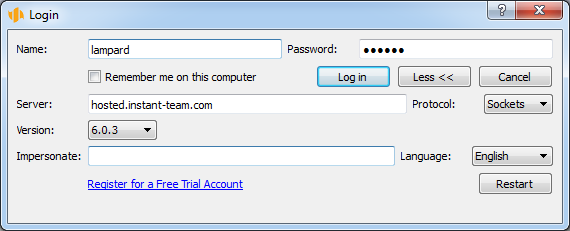
The following information is accessible from the login window after you click on the More » button. Its caption subsequently changes to Less « and the next time you click on the button the displayed information is hidden again.
The Instant Team Hosted address is hosted.instant-team.com
The Impersonate field serves to enable the workgroup administrator to log in to another user’s account without knowing or modifying their password. The administrator enters their login name and password at the top of the login window. The name of the user whose account they want to log in to is then entered in the Impersonate field. Impersonations are recorded in the application log so they can be traced back if need be. Automatic login cannot be combined with impersonation.
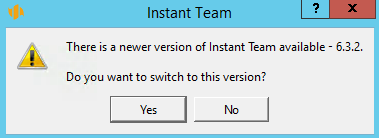
The Version field gives users the option of switching between available application versions, returning thus also to older versions. After selecting a version from a pull-down menu the application is terminated and the selected version is run automatically. If a new version becomes available the user is automatically notified about it via a dialog window and they are given the option to switch to it. If they do not do so then this is precisely where they can choose this version at any later time.
When labeling the versions, Instant Team currently uses the number format 6.x.y(z). All versions beginning with number 6 are mutually compatible, number x denotes a change on the part of the server, number y a change on the part of the client. Transition between x and y changes of versions is automatic or, more precisely, easily accessible through version selection in the login window. When the first number or the (z) number changes then a new client needs to be installed from Instant Team web pages.
Use the Language pull-down field to select the language used to display text in Instant Team.
The Restart button serves to restart the Instant Team client.
You can also choose the communication protocol to connect to the Instant Team server in the login window. If you are unable to connect to the server on the first try or consider the connection too slow, then you can try a different protocol. The available protocols are almost equivalent as far as functionality and speed are concerned and the choice of protocol should normally have no impact on your work with the application but it may happen that one of the protocols will not be compatible with your firewall or web proxy.
If you enter an incorrect combination of name and password you will be notified. Otherwise, the main application window will appear shortly.
Main window
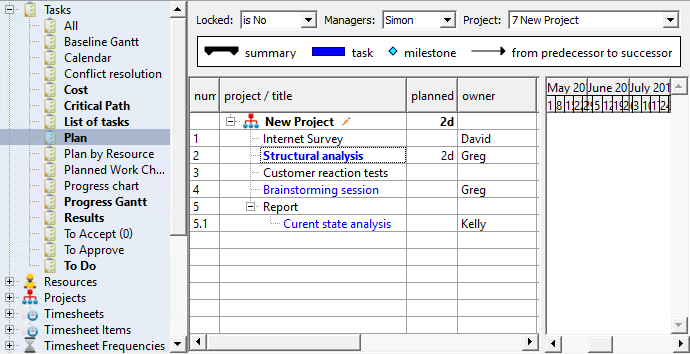
Look at the figure below to see what the starting point of your work with the application looks like. The upper part of the window displays menus and a toolbar with buttons, the left part contains a database panel. Most of the window is taken up by a view of the currently selected report. A status line can be seen at the very bottom.
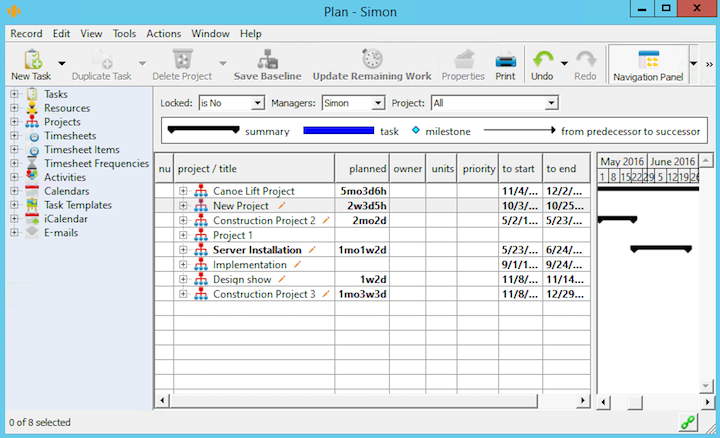
Menus and the toolbar
The purpose of the individual menus and buttons in the toolbar will be described further below both in this and the following chapters. Their content depend on your role in the application and on the currently displayed report.
The local menu above the toolbar will let you turn off text captions in the toolbar using the right mouse button, thus enabling you to save precious screen space. Further, you can turn on and off the toolbar in this way.
The navigation panel
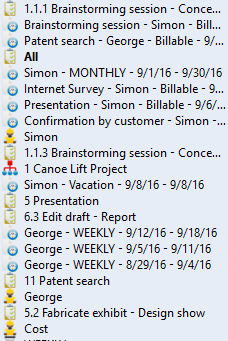
The left part of the window includes a vertical area called navigation panel. It it used to switch quickly among the individual predefined data views in Instant Team, which are called reports here. The reports are grouped by the database providing the displayed data.
Not all reports are available to all users. The list of reports available to you depends on the role you have been assigned within a workgroup.
You can change the width of the navigation panel by dragging the line separating the panel from the report or you can possibly hide it completely if it is reduced under a certain limiting value. You can also hide and unhide it using the View/Navigation panel menu or possibly the Navigation panel button in the toolbar.
You can edit names of reports in the navigation panel by clicking on the name of the selected report with the mouse. This subsequently displays a field where you can modify the name of the report and confirm your changes with the <Enter> key.
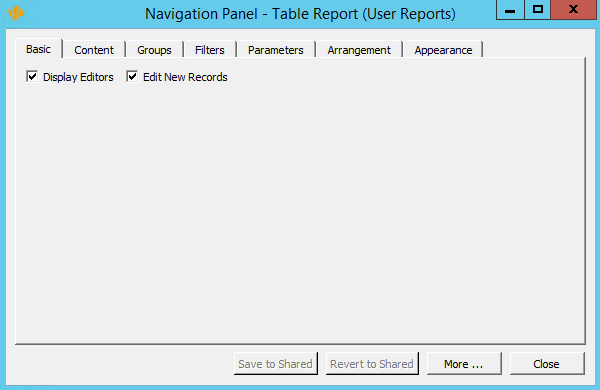
The navigation panel is customizable. This is a special report behaving in all respects like a normal report of the table type—see Chapter 11, section Customizing the Table report. The navigation panel customization window is displayed after you right-click the navigation panel under the report list and select Customize… from the local menu.
You can also switch between reports when the navigation panel is hidden using the View/Database/… and View/Report/… menus.
The client remembers the history of the reports you visited and you can navigate the history using Forward and Back buttons in the toolbar similarly to a web browser.

The Favorites panel
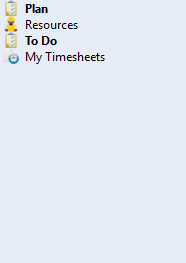
Instead of the navigation panel, you can also display a panel with your favorite items in the left part of the window. In this panel you can keep reports and individual records that you use most often.
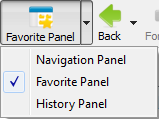
To display the Favorites panel, you can use the Navigation panel/Favorites panel/History panel button in the toolbar or the Display/Favorites panel menu.
You can add a report to the Favorites panel by selecting it in the Navigation panel and pressing the Favorites button in the toolbar or using the Window/Add report to favorites menu. Likewise, you can add a single record to your favorites.

To remove a report or a record from the Favorites panel, you select it in the Favorites panel or in the Navigation panel and press the Favorites button in the toolbar or use the Window/Remove report from favorites menu.
Reports and records can be moved up and down the Favorites panel by dragging them with the mouse.
The Favorites panel is shared by all workgroups of the user.
The history panel
Further, instead of the Navigation panel, the left part of the window can show a panel with the history of recently displayed reports and records.
To show the History panel, you can use the Navigation panel/Favorites panel/History panel button in the toolbar or the View/History panel menu.
Report
Almost all the rest of the window is occupied by the most essential item, the current report. Most often, a report is displayed in the form of a Table with its rows representing the individual records (tasks, projects, etc.) or groups of records (for example all tasks of a single user) and its columns representing fields in these records. Other report types include the Calendar report, which has the form of a planning calendar, the Chart report, which has the form of a bar chart for instance, and the Dashboard report, which enables you to display data from multiple reports at the same time. Individual report types and their customization options are described in detail in Chapter 11.
You can navigate a table report using the up, down, left, and right keys and the page-up and page-down keys or by clicking on any cell in the table. You can also move left and right using the <Tab> and <Shift+Tab> keys. Yet, at the end and the beginning of a row these keys will take you to the beginning of the next row and the end of the previous one, respectively. You can also use the scrollbar to the right of the report, which is displayed automatically when not all the rows fit on the screen.
For reasons we will describe later, the right part of some reports displays the so-called Value Line. These are either time-dependent record data or graphic or numerical comparison values. The values can be shown in the form of a table, as a bar chart or as a Gantt chart.
You can access the Value Line by clicking on it with the mouse. While within the Value Line, you can change the time period you want to display using the left and right keys. Also the scrollbar under the Value Line serves the same purpose.
In some reports, you can also modify the displayed values directly. To enter the embedded editing mode, you can use the <F2> shortcut key (<Enter> on Mac OS X) or click in a field you have already selected. You leave this mode using the <Esc> key (the new value will not be saved) or the <Enter> key (the new value will be saved).
The status line
The left part of the status line most often displays the number of selected against the number of displayed rows in a report. The right part then sometimes displays in a graphical form the progress of data reading from the server. And finally, there is an icon informing you of the connection status.

You can switch from the connected to disconnected status and the other way round by clicking on the connection icon. The letter W is sometimes displayed between the rectangle showing the progress of data reading and the connection icon. This means that data changes are being posted to the server in the background. The letter disappears after the posting is completed.

If not all the data is read or posted or if the client gets disconnected then the mouse pointer changes, too. You can keep working with the program but data that has not been read naturally cannot be displayed either.

Help
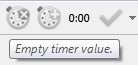
If it becomes unclear to you at any moment what is the purpose of a menu, button, input field or another control you can access context-sensitive help for the specific control. This is the purpose of the Help/What is it? menu and the <Shift+F1> shortcut key (which you can use even in windows without a menu).
Context-sensitive help
This action switches the application to the context-sensitive help mode. Then you need to move the mouse over the control you want explained and click on it.
A yellow box appears, containing concise help on the given control.
Explanation of disabled controls
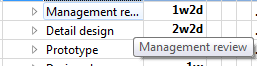
In addition to context-sensitive help, you can also get useful information on Instant Team controls thanks to help on disabled controls. If a control is disabled (it turns gray) then thanks to these help items, you can easily find the reason of this and possibly also find out how to get to a point where you can enable it.
This type of help is accessed by moving the mouse to the name of the disabled control and hovering for a moment.
You can turn off the explanation of disabled controls using the Help/Explain Disabled Controls menu.
Explanation of symbols following record names
Following the names of records, particularly of tasks, special icons sometimes appear indicating certain interesting properties of the records.
For example, one of these icons points out that there is a note attached to the record. If you hover the mouse over such an icon, details relating to the given property are displayed. For instance in the case of note icons, the entire text of the note is displayed as shown in the following figure:
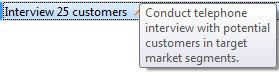
Displaying the content of clipped fields
Finally, we will describe one more type of tooltips. It is displayed at all places where some text does not fit in the area reserved for it. Just hover the mouse over the clipped text for a while again and the entire text including the clipped part will be displayed in a tooltip box.
User’s guide
And last but not least, this guide is also available in Instant Team in an electronic form via the Help/User’s Guide menu.
Technical support
If all your attempts to find help fail please do not hesitate to contact our technical support. The easiest way is to use the Help/Technical Support menu. This will open your e-mail client and generate a new message addressed to the Instant Team support. Now you just describe your problem and send off the e-mail.
Creating records
When you launch Instant Team for the first time the displayed report will be most likely empty and the same applies to all other reports you try to switch to. The reason for this is simple: so far, the application contains no records, i.e., no tasks, projects or timesheets.
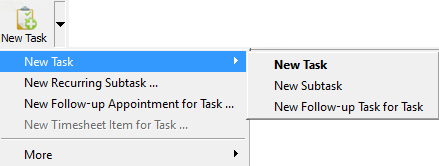
When creating records you will use the New menu and the very first button in the first toolbar within the main window. Both the menu and the toolbar button include a submenu with one item for each database in which you can create records. If there are more options when creating a record from a given database then the specific item has another nested submenu.
For example, to create a new task, you have the following options: New task, New subtask, New task for a project, New task for a day, New task for a resource, New follow-up task for a task, and New follow-up task for an appointment. The difference between them is described below, in subsection Deriving fields.
However, not all the options will be available in every report. Some of them require certain context type to make sense and if the context is missing in the currently displayed report then the option of creating a given record will not be available either. For example, the New task for a day action is only available in the Calendar report. Some actions can also be unavailable due to the fact that the logged in user does not have sufficient rights to access them.
In addition to the menu and toolbar button, you can also use the <Ctrl+N> shortcut key to create a new record from the currently displayed database and <Shift+Ctrl+N> to create a sub-record in the displayed database, that is, a subtask in task reports and a subproject in project reports.
Using any of these methods, a new line with a new record is generated in the currently opened report, the Name column is selected, and the report switches to the editing mode. The new record is thus ready for its name to be entered.
Depending on the specific report type, the record row will contain columns displaying other fields. Use the mouse or tab key to move between individual fields to be filled out.
If you want to display a newly created record in a separate window and to fill in the individual field values directly there, double-click the record row or highlight the record row to be opened in the report and:
- use the Properties… toolbar button, or
- use the Record/Properties… menu, or
- double-click on the record in the report or
- use the Properties… option in the local menu of the record (the local menu
is displayed after right-clicking on the record).
The newly created record is sometimes opened directly in a separate window, for instance in the case of a new timesheet. The newly created record is also opened in a separate window if this new record cannot be displayed in the background report, that is, for instance, when a new task is created within the Projects database.
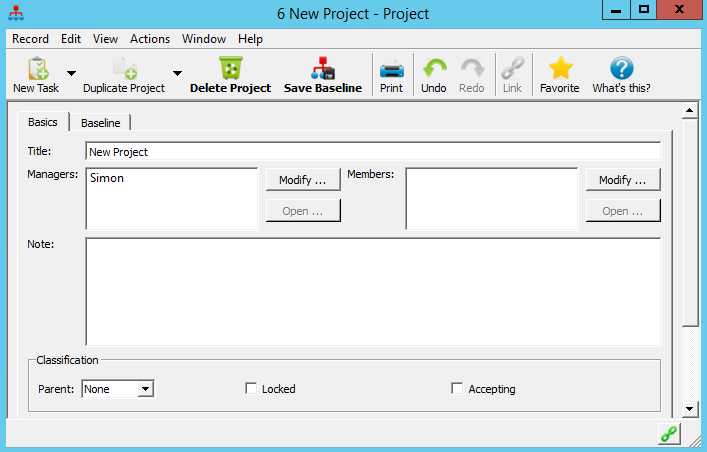
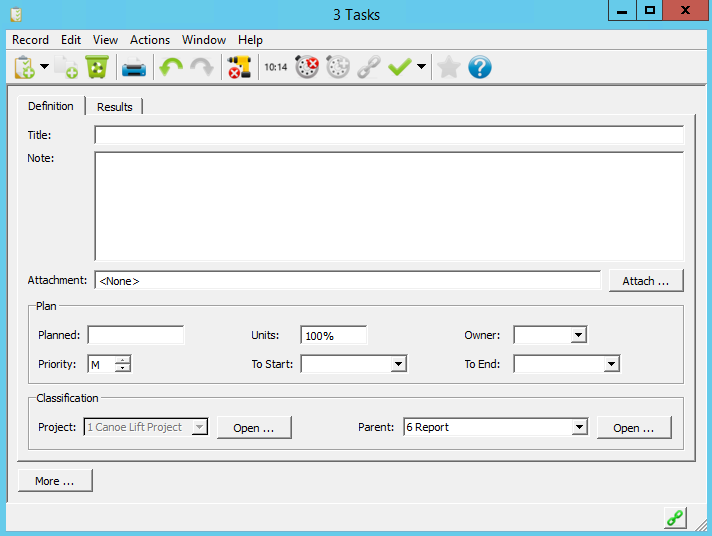
Record window
The record window shows you the individual fields that can be filled out for a given record. The fields are organized into tabs between which you can switch by clicking on the tab’s handle.
The menus and toolbars in the record window are similar to the main window and they generally serve the same purpose.
After filling in all the required information you can close the window. This will take you back to the main window.
Deriving fields
When you create a new record some of the fields will be pre-completed. Instant Team takes into account the currently displayed report and possibly also the active row in the report and, based on this information, tries to pre-complete some fields.
For example, if you view a report on completed tasks then a newly created task will also be completed. If the records in this report are grouped by task owners then a new task will have its owner pre-completed according to the owner corresponding to the currently selected row.
Fields are also pre-completed in context dependent actions. For example, the New Subtask action pre-completes the Parent field with the task in the context of which it was used. Therefore, it is only available in the context of a task. That is, either in the task window or a task report where, additionally, a task must be selected. Likewise, New task for a project pre-completes the Project field based on the context and New task for a day pre-completes the To Start/To End field based on the context. In the latter case, the context must be the Calendar report and the field is pre-completed with the start day of the currently active calendar box. The new follow-up task for a task or for an appointment then fills out the Project and Owner fields based on the context of the selected task or appointment.
The best way to find out how this pre-completion proceeds in a particular report is to use the context-sensitive help on the New Record… button, etc.
Thanks to the pre-completion of fields, it can happen sometimes that you will not be able to create a new record. Such a situation occurs when your access rights do not comply with the prospective pre-completion. Or, vice versa, it can happen that the pre-completion is insufficient. For example, you will not be able to create a new note/attachment in the Active report within the Projects database until you select a report row containing one of the displayed projects.
Duplication
Using the Duplicate menu and the corresponding toolbar button, you can also create a copy of already existing records. The Duplicate action generates a new record with most of the field values pre-completed according to the selected record. The only exception is the Title field.
Moreover, in case of tasks, task templates, and project templates, all subtasks will be copied. Therefore, you can easily create a copy of an entire task hierarchy including the plan, predecessor-successor relations, etc. In case of projects, there are two options: the Duplicate project action copies the basic project data from the project window, the Duplicate project including tasks action enables you to copy the complete project.
Highlighting unread records
Report rows can either be displayed as regular text or they can be highlighted.
A record is displayed in bold if the logged in user has not yet viewed it in its current form or if they have marked it as unread. A record can be marked as Unread (or as Read) using either the local menu of the specific record or the Actions menu. Using these menus, status of multiple records can be changed at the same time.
If an unread record is contained in a hierarchical group (see the section Working with hierarchies later in this Chapter) or report, the entire group or report is highlighted in bold.
A record is deemed unread (and is thus displayed in bold) if the current user has not yet displayed its properties, if the record has been changed by another user since the record was last viewed by the current user, or if the current user has marked it as unread.
If a report contains an unread record, it is also printed in bold. However, one must not deduce that if there is at least one unread record in a database, there also needs to be at least one report printed in bold. This is because the content of a report is not defined by the set of all records that can be possibly displayed in the report but by the set of only those records that are actually displayed in the report. If the only bold record is “disqualified” from a report after resetting its parameters, for example, the report itself will no longer be printed in bold.
Email notifications about record modifications
The same function as the bold font is provided by email notifications sent out when a new record is created or an existing record changed by another user.
Unless email notifications are disabled for a user (described below in Chapter 3, section User account administration), the user is notified by email if any record is created or changed. Change notifications are sent out only in the case of the first change since the record was last displayed by the user.
Emails distributed by the Instant Team application include all necessary information in the subject of the message. First, information about the type of the created or changed record are provided, then its name, the author of the modification, and the date and time when the record was modified.
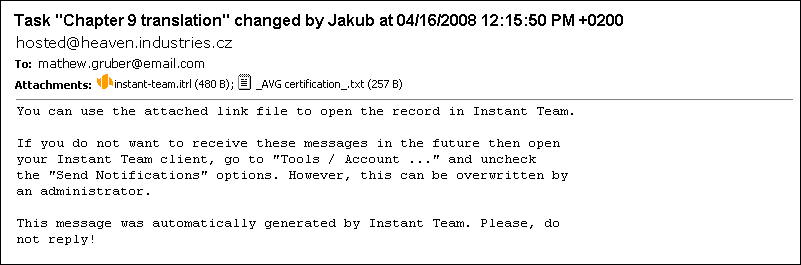
The email messages include an attachment where you will find a shortcut to the specific modified or newly created record (see subsection Record shortcuts below). The body of the message contains general information regarding these email notifications.
No emails are sent in case of timesheets.
Deleting records
You can delete a previously created record just as easily as you created it. However, you need to have sufficient access rights to do this.
For example, you can use the Delete button in the main window, which deletes records (also multiple records at the same time) you marked in a report. The Record/Delete menu and the <Ctrl+D> shortcut key work the same way, too. Or you can first display the details of a record and then delete it using the Delete button from the toolbar or via the Record/Delete menu directly in the record window.
If a report of the Dashboard type is displayed then the Delete action accounts for the currently active report in the menu and toolbar. It deletes the record selected in the active report.
The Delete action from the record window deletes the record. If, however, an embedded report is active then the Delete action removes the selected records from the embedded report.
When records are about to be deleted a warning is displayed first.
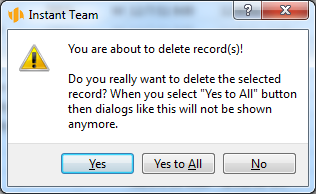
You confirm deletion of the selected record with the Yes button, you cancel the action with the No button. Using the Yes button, you remove the record and, moreover, next time a record is deleted from the same database the query is not displayed.
If there are records linked to the record about to be deleted, these linked records are not automatically deleted but only unlinked from it. But it may happen that thanks to this unlinking the records will become inaccessible.
Bulk modifications
If you want to delete multiple records at the same time you first have to select multiple ones in the report. This you can achieve in different ways:
- While pressing the <Ctrl> key you click on the records you want to select—you thus select precisely these records and, additionally, also the record that has been active until then.
- While pressing the <Shift> key you click on another record—this selects all records from the active record to the record you clicked on.
- While pressing the <Shift> and <Ctrl> keys simultaneously you click on another record—this is analogous to <Shift+click> but you can select more areas at the same time.
- While holding the <Shift> key you navigate the report using the up and down keys—the original row remains selected and, additionally, the row (rows) above it or under it become selected, too.
After marking more records at the same time you can not only delete them together but also change them together. To this end, you can use the editing field in the report, for example.
In a situation when editing is not allowed in the current report or if you need to modify the value of a field that is not displayed as a column in the current report then the best way is to display a detailed view of the selected records. This you do the same way you display the details of an individual record, i.e., using the "Properties…" toolbar button for example.
The window that is displayed now is almost identical to the detailed view of individual records. However, the window header logically does not show the name of a record and instead it only displays information on the type and number of records. Also, the window does not show the values of any fields that are not identical across all selected records.
If you set a value in any field then the change is automatically performed in all selected records.
The Undo function
It can happen sometimes that you mistakenly delete a record or perhaps you modify it but later change your mind. To simply go back one step, you can use the Undo button in the toolbar. This performs an action opposite to the one you have just performed.
If this meant creating a record then it will be deleted. If this meant deleting a record, it will be restored. If you changed the name of 50 selected records to the word “blah-blah”, the original names of all 50 records will be restored.
In this manner, you can revoke almost all actions that modify data but only if the change is posted to the server. Therefore, some actions cannot be revoked using the Undo button. For example, values of most text input fields are only posted to the server after you confirm the new value.
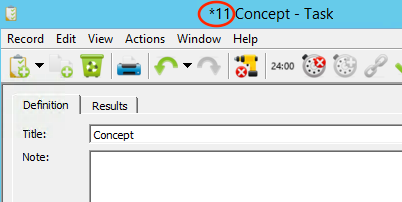
A modified value that has not been posted to the server yet is indicated in the window title in a manner depending on the operating system. Windows and Linux have an asterisk in front of the window name, Mac OS X then has a dot in the red icon used to close the window. The Undo function in such a halfway situation restores the last value posted to the server.
You can achieve the same result in this case using the <Esc> key. To confirm a value and post it to the server, use the <Enter> key. To confirm it, you can also just go to another field (by clicking on another field, using the <Tab> or <Shift+Tab> keys, closing the window, etc.).
In addition to the Undo button, you can also use the Edit/Undo menu and the <Ctrl+Z> shortcut key to go back.
You can also use the Undo function repeatedly and thus proceed deeper into the history. However, you will never get beyond the last client launch or the last login to Instant Team.
Very rarely, it can happen that between an action and an attempt to revoke it, data has changed so much that restoration is not possible. In such a case the Undo function will be disabled.
It can happen, for example, that you modify some of your tasks and the project manager reassigns them to another user after a while. If you are in a role that does not enable you to change other people’s tasks (for example the Member role) you will naturally not be able to revoke the action.
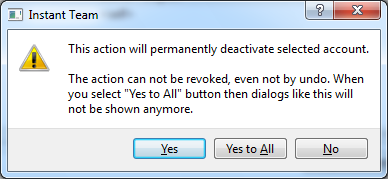
Some actions, for example user deletion, can never be revoked. However, you will always be warned before performing such an action.
Working with hierarchies
Most of the ready-made reports do not have the form of a simple table and instead they are grouped by a certain value (or more values). This is revealed by the fact that the basic listing does not contain tasks or projects as rows and instead it contains the names of groups into which the displayed tasks or projects belong. If a report is grouped, the header of the column containing the names of groups and records is labeled with the names of fields based on which the groups are formed.
An example of such a group are task owners. The report then displays one row for every task owner.
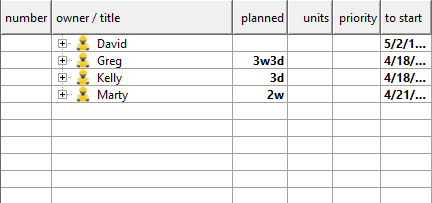
To the left from the name of a group and the icon or name of its group type there is an icon indicating the open or closed status of the group. By clicking on this icon you open or close the group.
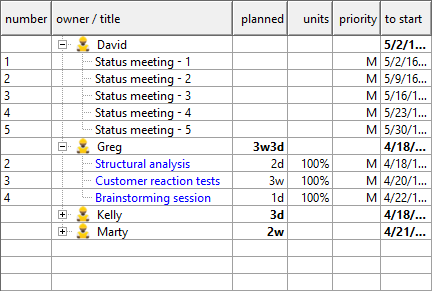
If a report is not grouped any further then if you open it you will get a detailed view of the records—in our case of tasks. To open and close groups, you can use the <+>, <->, and <*> keys, the local menu above the name of the group, and the View/Hierarchy menu.
The Expand Branch option or the <*> key expands the active group and if there are further groups hidden underneath then it also expands these and it proceeds in this manner all the way to the detailed records.
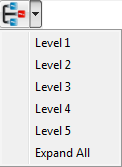
The View/Hierarchy menu and the toolbar also offer the Expand all and Level 1-5 actions. The Level 1-5 action expands all those groups in a report that are located on the specified and higher levels. Vice versa, if the groups located on lower levels are already expanded they will be collapsed.
The Expand All action then expands all groups.
The Level 1-5 and Expand All actions work as switches. This means they are still active after you use them even if, for example, another group has been created in the report in the meantime. Their function only expires after you use another action from the Hierarchy menu or after you call a function controlling the hierarchy in another way.
However, be careful about using this function in very long reports. This is because expanding a report of thousands or even tens of thousands of rows slows down your work with the report significantly.
Recent records
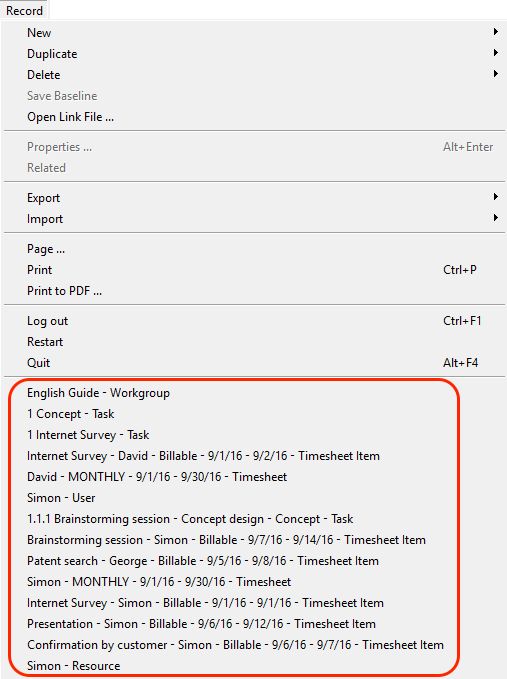
The most recently created, modified or just displayed records can be easily accessed via the Record menu where links to the most recent records are listed in the bottom part of the menu. When clicking on any of the links, a new window pops up in which you can view or modify the record. A maximum of 20 recently displayed records are shown in the list.
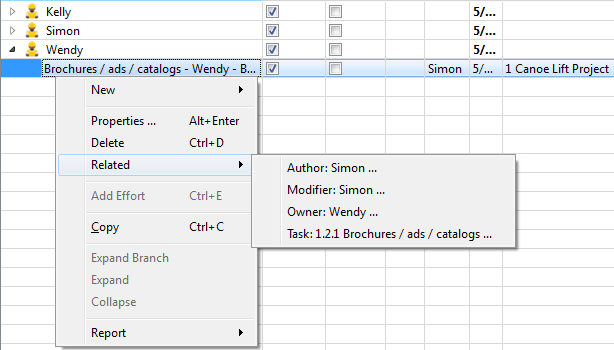
Related records
The local record menu in the left part of a report offers the Related menu using which you can quickly proceed to records related to the selected record in some way. For instance, as regards tasks, you can thus proceed to the task and project owner, predecessors and successors, etc.
Record shortcuts
With the record properties window open, you can save a shortcut to the currently open record directly to your operating system’s file structure via the Record/Save link as… menu.
The link has the form of a shortcut with the .itrl extension. In the file system, the shortcut will be displayed with the Instant Team icon. In response to opening the shortcut, the Instant Team log in screen is displayed and after successful login the user is brought to the specific record.
The shortcut can be accessed also directly from the application using the Record/Open Link File… menu.
Quick search
After you succeed in entering so many tasks and projects into Instant Team that you have a problem finding a particular task or project in the report, the quick search function will come in handy. Using quick search, you can locate any string contained in a column of the displayed report.
First choose in which column you want to search and activate it by clicking the mouse on any cell within this column or using the left and right keys. Then use the <Ctrl+F> key combination to turn on the quick search mode. As soon as you begin typing the first letters of the text you search for, the program will immediately start looking for a row that contains the given text in the active column, one letter after another, and regardless of lower- or upper-case letters and of where the respective text appears within the cell.
When you do a quick search the search column is displayed above the report (you can also switch it here) along with the number of records found, buttons taking you to the previous and subsequent lines found, the text you searched for, and the button to stop the quick search and hide all these controls. Lines that are found in the report are highlighted in bold and yellow in the search column.
To move to the subsequent and previous lines found, you can also use the <Ctrl+G> and <Shift+Ctrl+G> shortcut keys, respectively. You can also stop the quick search using the <Esc> key. You also have available the Edit/Find and Find Again menus or the local Find and Find Again menus, which are displayed if you click on an empty report row with the mouse.
Quick search only enables you to search those rows that are displayed in the report. Therefore, if some of your groups are collapsed their records will not be considered.
Copying reports to clipboard
If you need to share Instant Team data with other applications or further process the data outside of Instant Team you can either export it to a file as we will describe below in Chapter 15, Data exports, or you can simply transfer the data to another program via the clipboard.
Just choose the report from which you want to transfer the data, select the rows you wish to transfer, and use the Edit/Copy menu, the <Ctrl+C> shortcut key or the Copy action from the local menu. Then you need to switch to the application you want to transfer the data to and paste the data there from the clipboard. A whole range of applications supports such data transfers; most often, however, it is used to transfer data from Instant Team to Excel.
Printing
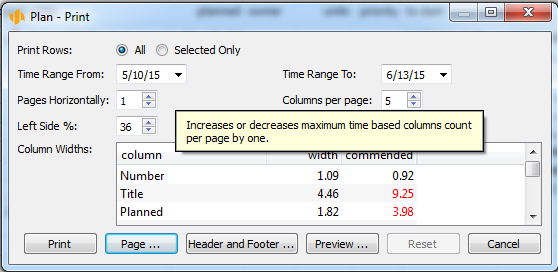
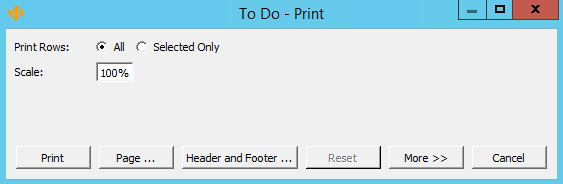
In addition to viewing any report, you can also print it out. To do this, use the Print button in the toolbar or the Record/Print menu or the <Ctrl+P> key combination. Before printing starts a window pops up to set the printing parameters.
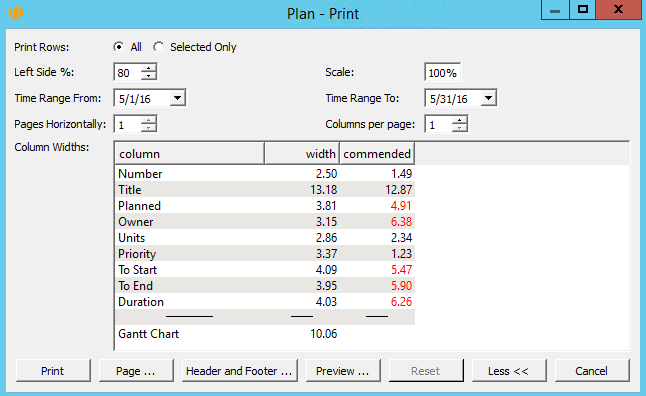
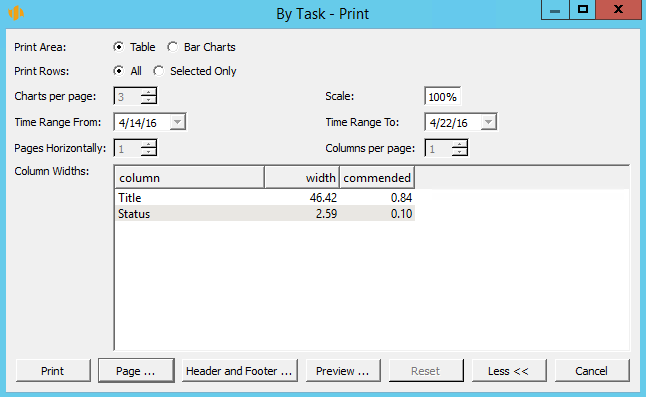
You can choose whether a report is to be printed whole or only its selected rows. For reports that contain a value line, you can additionally choose to print a time interval or a value range different from the currently displayed ones.
In the Landscape pages field you can set the number of landscape printed pages. When you change this value the number of columns per page is automatically recalculated.
You can also select the number of columns per page to be different from the displayed one. In case of printing more columns than the number of columns per page, the report will be printed repeatedly, starting with the first columns and then with further and further columns until they are all printed out. If the number of columns per page is changed then the Landscape pages value is recalculated automatically.
The Left Side Percentage field enables you to define what fraction of the printout width will be taken by the left side if the report also includes a value section. It is not possible to enter a value less than 10% and greater than 90%. If the ratio is modified then column widths are recalculated automatically, see below.
If you wish to optimize the size of the text in the printouts, change the value in the Scale field. The default value is 100%. If the output does not fit within the page then enter a lower value, if there is blank space on the page then enter a value greater than 100%.
The Column Widths table enables you to set the width of each report column in the printout. It also displays the recommended width for each column based on the values within the first 100 rows of the report. A recommended width greater than the set width is highlighted in red. It is also possible to set the width of the value section, in this case the recommended width is not displayed. When column width is changed the system checks whether the left side fraction is not less than 10% or possibly greater than 90%; when value section width is changed the value of the left side fraction is recalculated automatically.
In addition to setting these printing parameters, it is also important to set page properties, which are available via the Page… menu.
The hierarchy within a report is printed in the same form it is displayed. Therefore, if some of your groups are collapsed they will also be collapsed in the printout.
The Header and Footer… button opens a window where you can set text to be printed in the upper and lower sections of the printout.
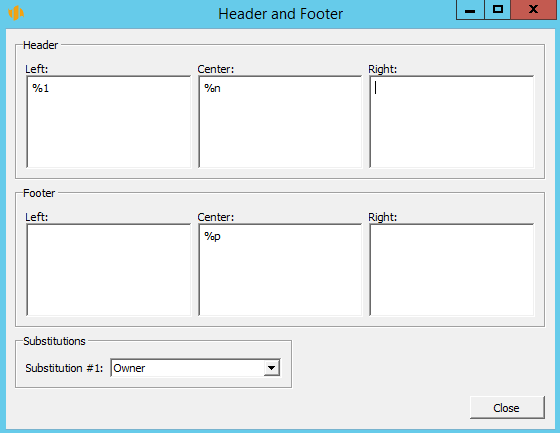
Both the header and footer are divided into three parts—left, middle, and right. With the default setting, the name of the report or record is printed in the middle section of the header and page number is printed in the middle section of the footer. In addition to arbitrary texts, you can also use in the header and footer some symbols with a special meaning. The meaning of the symbols you can use is as follows:
%c number of pages
%d printing date in the form "day of the week, dd. mmm yyyy"
%n name of the report or record
%p page number
%t printing date and time in the form "dd.mm.yy hh:mm"
%u first and last names of the user
The set header and footer are valid for all reports.
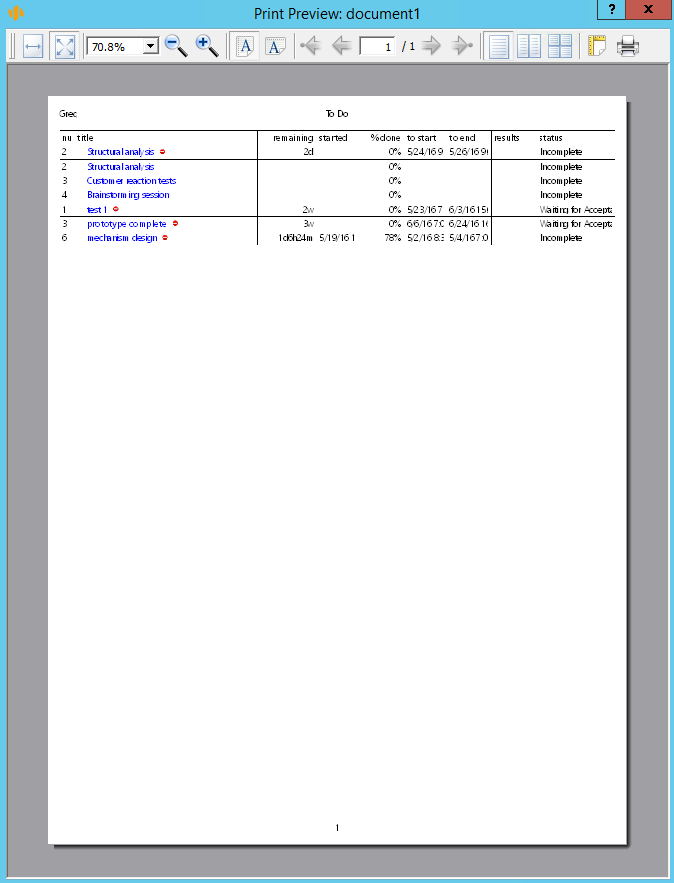
Using the Preview… button, you can display a window where you will see what the printed report will look like.
The Reset to Default button serves to revoke all changes you made in the setup window for the printing parameters; parameters for the given report will be set to defaults.
Printing bar charts
If you choose to print a report that includes time-based values displayed in the form of bar charts, additional options will become available to you.
Bar charts cannot be printed together with a table and you will thus first have to select whether you want to only print the table—the left part of the report—or the charts—its right part. Selecting charts automatically ticks the option Print Selected Rows Only in order that the printout correspond to what is displayed. However, you can uncheck this option if it does not suit you.
In addition to the usual Value Line options you can also set the number of charts per page to be different from your selection for on-screen viewing.
PDF printing
You can also export a report in its printable form into the PDF format (Portable Document Format by Adobe), which is suitable for file sharing—e.g., for e-mailing—because a PDF document viewer is already installed on almost every computer today.
You start printing by selecting the Record/Print to PDF… menu. The printing parameters remain the same as when you print on a printer but you additionally enter the name of the file where the report is to be exported.
You enter the filename in a dialog window after pressing the Print button. You can use the preset name "print.pdf" or select your own name and enter it into the File Name box. The dialog window further lets you select the folder to save the PDF file to.
Printing records
In addition to printing entire reports, you can also print the individual records. This function is available from the record window using the Print button in the toolbar or via the Record/Print menu. Printing of records is also available in the local menu, which is displayed in the report above the row containing the record.
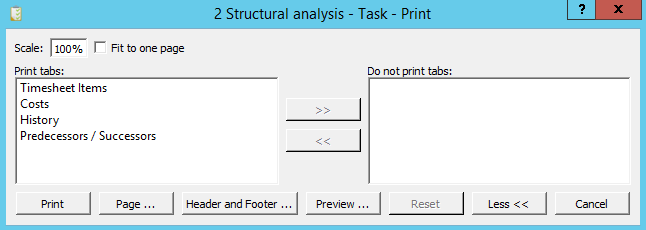
The printing window enables you to select which tabs from the record window will be printed. The Print Tabs list contains tabs that will be printed, the Do Not Print Tabs list in the right contains those that will not be printed. To move fields between the lists, use the arrow keys, « and ». Fields selected with the mouse or keyboard will be moved.
If you check the Reduce to one page check box a suitable scale is determined automatically so that all the record data would fit in one page. In that case the Scale field is unavailable.
Logout
To logout from the application, just close the main program window. Alternatively, you can use the Record/Exit menu or the <Alt+F4> key combination.
If you do not want to close Instant Team completely and you only want to log in as another user, use the Record/Log Out menu or the <Ctrl+F1> shortcut key. All your open windows will close and you will proceed to the initial log in dialog.
Before the application is closed, all local data are sent to the server. During the operation a window may be displayed shortly, informing the user that the data transfer is still in progress. As soon as the transfer is completed, the window disappears.
Since all changes made by the user are always stored on the client’s computer as well, there is no reason to fear any loss of data, even in case of sudden interruption of connectivity to the Internet, for example. Therefore, the window with the data transfer information can be closed using the Cancel button if there is any delayed response. The application will be closed and the data synchronization will take place after the next login.
Restarting the application
While working, the application stores temporary data to special local and server files. Especially when you work with the application for a longer period of time or if it seems to you that the application response becomes too slow, it is possible to discard the temporary data by restarting the application.
60 days overview of all dates, capacities, inputs and outputs about each project and completely free.
All rights reserved, Created by eBRÁNA Privacy statement