User’s manual
In this chapter:
Project plan
Conflict resolution report
Attachments
Predecessors of a task
Critical path
At the heart of every project there is a schedule of activities for the given project (Work Breakdown Structure). The schedule reflects which activities are to be performed within the project, who is to perform them and when, an estimate of time the activities are going to take, and dependencies between the individual activities.
Project activities are called tasks within Instant Team and in order to work with them, you thus first need to switch to the Tasks database. Therefore, use the Navigation panel or the View/Databases/Tasks menu.
Specification of the breakdown of activities is reserved to project managers (users with the Manager role listed among project managers of a particular project) and it is accomplished using the symptomatically called Tasks report (the View/Report/Tasks menu).
Entering a task
If you are in the Tasks database, use the <Ctrl+N> shortcut key or the Record/New/New Task menu to create a new task.
A new row is generated at the corresponding position in the report where you can enter information about the new task using the editing fields. Press <Tab> and <Shift> + <Tab> keys to move between individual fields in the report or click on the individual fields of the new task with your mouse.
Initially, it is sufficient just to fill out the Title field. Title should briefly characterize the task. Other information about the task (such as the Note field for a detailed description of the task) can be edited at any time in the properties window of the task, which can be accessed for instance by double-clicking on the new task row.
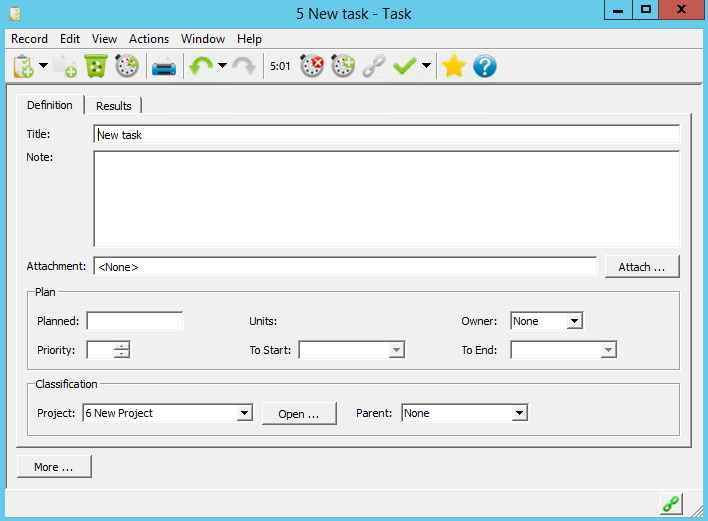
The Project field shows the name of the project where this task belongs. The value None in this field means that this is a task that does not belong to any project and only you, its author, can view and modify it.
Similarly to projects, tasks are numbered automatically and can form a hierarchy. Therefore, every task has the Parent field that determines its position within this hierarchy. The value None in this field means that this is a highest-level task. You can set the parent of a task only after the task has been created or the parent can be preset already when creating the task—being the parent of the task you selected in the report before creating the new task. To pre-complete the parent, you can also use the New Subtask action, which pre-completes the currently selected task as the parent. It has its own shortcut key: <Shift+Ctrl+N>.
You can also comfortably change task order and hierarchy using the mouse. The procedure is analogous to the case of changing project order and hierarchy, which we have described in the previous chapter.
The tasks can be also be dragged-and-dropped between various projects. If you move a task from one project to another in a report grouped by project then what changes is not only the value of the Parent field but naturally also the value of the Project field.
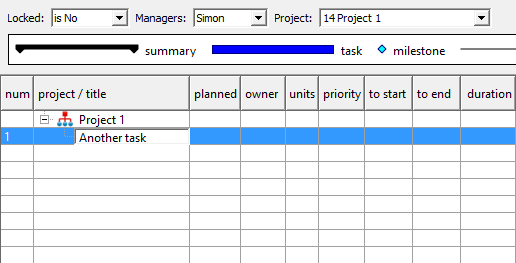
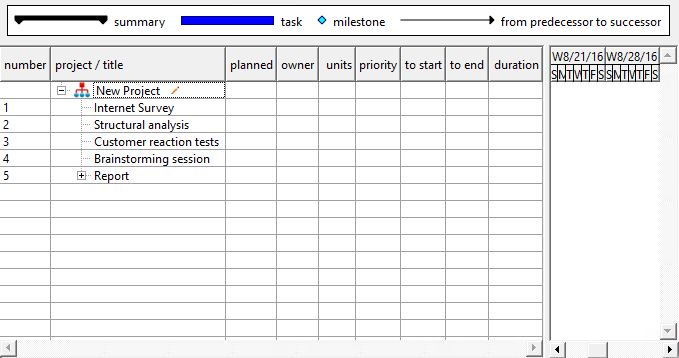
After adding tasks to your breakdown of activities for the first time, it can look for instance like this:
Project plan
Tasks are listed according to the order they were created. You cannot see in what sequence they should be performed or when and by whom. In order for your schedule to reflect this information as well, you need to fill out the Plan section in the task window.
Effort estimate
Let us begin by filling out the Planned and Owner fields. The Planned field serves to enter an effort estimate for a task. Possible entries are for instance 2h, meaning two hours, or 1d for one day, or perhaps 2.7w for two and seven-tenths workweeks. It is also possible to use a combination such as 1d2h for one day and two hours. Units we have not mentioned yet are month (entered as a string “mo” after a number) and year (y).
One hour still has 60 minutes—there is no difference here—but one day no longer has 24 hours and instead it only has 8 hours (and thus 480 minutes). One week then has 5 days (2,400 minutes). A month has 4 weeks (9,600 minutes) and a year 12 months (115,200 minutes).
If we express time in hours then one week has 40 hours, one month 160 hours, and one year 1,920 hours. Similarly, one month corresponds to 20 days and one year to 240 days.
You can enter a value into the Planned field—as well as other fields necessary to complete a project plan—in the window displaying the individual tasks or, more comfortably, directly in the Plans report. This is achieved using the editing field that appears in the report after you press the <F2> key (<Enter> on Mac OS X). The value of the selected report cell is always displayed here and you can also modify it here.
Note also that the value from the “Planned” column is summarized for group tasks and also for the entire project. The Plans report thus immediately allows you to see effort estimates not only for the individual tasks but also for all task groups and the project as a whole. To ensure better orientation, all summarized values are displayed in bold in the reports.
Assigning a task
The Owner field contains the resource to which the task has been assigned.
You do not have to assign tasks one by one—you can also change task owners collectively. You just simultaneously select all tasks for which you want to set the same owner (to do this, use for example the mouse and click on the individual tasks while holding the <Ctrl> key) and then you open the selected tasks in any way you prefer.
This opens a window for bulk task modifications. The window header states how many tasks are displayed at the same time. Field values are only shown if they are identical for all selected tasks and a change of field values in this window takes effect in all selected tasks.
You can also perform bulk changes if you edit items directly in a report, changing thus the values of all fields in the report and not only the Owner field. However, you need to select the corresponding field.
You can assign a task to multiple resources at the same time. In that case they will share the effort equally among themselves. You do this using the special value Multiple… in the drop-down menu of the Owner field.
The owner of a task can also keep the value of None. This value is useful in case you have not decided about the task assignment yet and also for milestones, i.e., tasks without an effort estimate, and for summary tasks, i.e., tasks with subtasks.
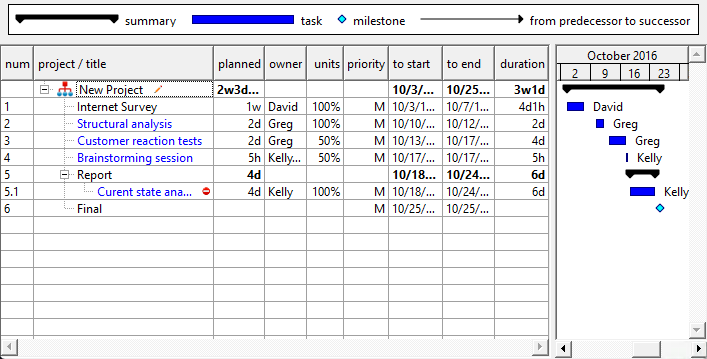
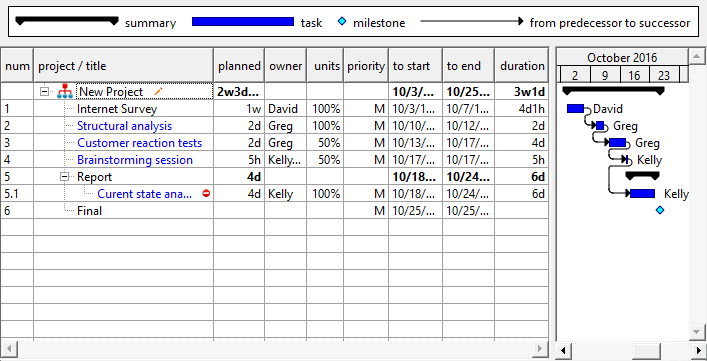
After you complete effort estimates and assign tasks, your schedule will look roughly the way shown in the following figure.
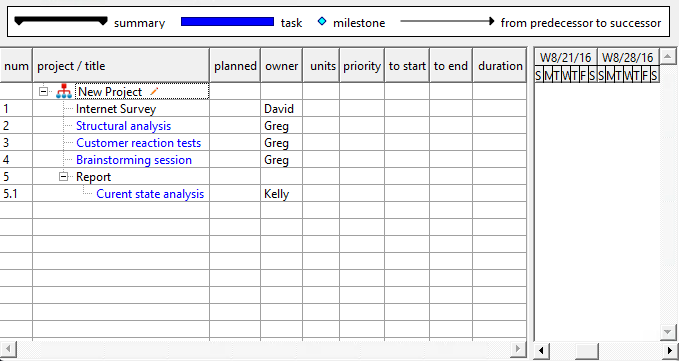
Tasks that you assigned to other users are displayed in blue. Tasks created by a user logged in to the computer but assigned to a resource of another user are highlighted like this in all reports. Likewise, tasks that are assigned to you but created by somebody else are shown in red. The neutral black color is only reserved for tasks that you did not create and that are not assigned to you or, vice versa, those that you created and that are also assigned to you or are not assigned to any resource.
A project plan viewed by a project manager then typically looks like a number of blue tasks (delegated) and several black tasks (these are left for the manager). Conversely, when viewed by a project team member, the schedule typically contains a large number of black tasks (for other team members) and several red ones (assigned to the given team member).
If you enter an owner for a summary task—that is a task with descendants—then the owner is automatically copied to (inherited by) all its descendants without an owner specified. Such inherited owner is shown in gray color.
Units
In the following column, you can fill out how much of a resource’s capacity will work on the task. The default value of 100% means you expect the assigned resource will apply its full capacity to the task. If you select a lower value the resource will be able to pursue other tasks too but task duration will increase. If you select a value higher than 100% then task duration will decrease at the expense of overloading the resource.
The standard capacity of all resources is the same, 8 hours a day, Monday through Friday. So, for example, entering units of 50%, you are telling the system the resource will work on the task only 4 hours a day.
Entering the value of 300% then, you can tell the system the resource will work 24 hours a day. Even that can be an appropriate value if, for example, you use a bulk resource representing an entire group of people. Then you can interpret the value of 300% as 3 people working on the task at the same time.
Manual scheduling
What remains to be done is to complete the Priority, To Start, and To End fields. You have three options. Either you schedule the task for a specific date you select (manual scheduling). Or you only select task performance priority among all the tasks of its assigned owner and let the computer calculate a particular date (automatic scheduling). Or possibly you can say the given task begins as soon as all its predecessors are finished (predecessor scheduling). You can combine these three methods arbitrarily within a project.
If scheduling manually then in the To Start field you set the date you expect work on the task to begin. The Priority field now shows the value “M” (manually) meaning that this is a manually and not automatically scheduled task.
The system calculates the task completion date on its own. To do this, it takes into account the task’s effort estimate from the Planned field and the value of Max. Units of the particular resource. If the effort estimate is zero then the task’s work completion date is identical to the task start date. If it is exactly one day then the completion date is the workday following after the start date, provided that the Max. Units capacity has been set to 100% for the particular resource, etc.
You can also set a task’s completion date to a value other than the one recommended by the application. If, for example, you set a later date then you are telling the system that you expect the task owner not to apply all their free labor capacity to the task in the period To Start-To End. If, on the other hand, you set a shorter period, it means you expect the owner to apply a higher percentage than what is indicated as maximum amount for the resource in the given time period.
After you enter a task start date, the task will also be displayed in a Gantt chart, which is a part of the Tasks report. If you did not enter a task’s effort estimate and you set a completion date identical to its start date then the task will be displayed as a milestone (a blue diamond-shaped icon).
If you enter a task plan, that is, you fill out the Priority, To Start or To End field in a summary task—that is, a task with descendants—then this plan is also inherited by its descendants where you did not set another plan. Values in the To Start, To End, and Priority fields are shown in gray color for tasks that inherit the plan, to separate them from manually entered plans.
Plan inheritance can be used, for instance, in the following situations:
- You want to simplify the planning process. You create a detailed work breakdown structure together with the effort estimates but only enter the planned start and end dates for summary tasks or for some detailed tasks and some summary tasks. The system will act as if work on the detailed tasks would proceed simultaneously in the time frame reserved for the summary task.
- When considering a detailed planned task you entered you decide that the task can in fact be broken down into several smaller tasks. You create these detailed tasks as descendants of the original task. You do not have to specify their owner, effort estimate or the start and end dates.
Manual task scheduling entails several problems:
- When determining the beginning and end of a task, accuracy of days is not sufficient if tasks do not take an exact multiple of days.
- Any changes in a manual schedule you prepared or work on are very arduous.
- When entering a manual schedule, it is not easy to achieve a situation when no resources are overloaded.
Therefore, manual scheduling is only appropriate for tasks having a fixed date that you do not have to change often or, preferably, at all. This is the case particularly for all project milestones (here, in contrast, shifts and automatic changes are unwelcome), appointments, status meetings, external restrictions, etc.
Automatic scheduling
As regards common project activities, the most suitable option is to use predecessor scheduling, which will be described below in subsection Task predecessors, or to use automatic scheduling. It is based on automatic resource utilization and you can thus only use it with tasks that have already been assigned a resource—and one resource at most. When scheduling like this, project manager only enters job priorities for the individual activities of a given resource or they can possibly also set the value "C" here. Tasks with this value are then assigned a particular numerical priority by the system and it is always the highest possible value in view of all automatically planned tasks of a given resource.
When scheduling automatically, suitable task start and end dates are calculated by the system. We must keep in mind two things here:
- Tasks are ordered separately for each resource because different people can work on tasks simultaneously.
- Tasks of a single resource are ordered collectively for all projects because one person will surely not split into two for the sake of two projects—their capacity remains the same.
The algorithm calculating a suitable date to start and finish a task follows these rules:
- Utilize the resource as much as possible, that is, consume all the resource capacity corresponding to the current value of Max. Units every workday (Monday through Friday).
- Keep the sequence of tasks at all events, i.e., abide by the predecessor-successor relations (see below).
- Take manual scheduling as primary. Therefore, if certain work has already been scheduled for a given day via manual scheduling then the capacity assumed during automatic scheduling is less by this amount.
When scheduling automatically, the Priority field contains a number that determines the priority of a task within the framework of all tasks of the task owner. Automatic resource utilization does not order tasks rigorously according to this number, it only takes it as a hint. If a task with a lower number cannot start because its predecessors are not finished yet then the system schedules a higher-number task before the former, if the latter can start already.
If you are scheduling a project that will begin sometime in the future, which is typical, create a special milestone task in the project and set its date to be the day you expect the project to start. Then include the milestone among the predecessors of a priority-1 task/tasks and these will be automatically placed only after this milestone. You will learn more about predecessors farther below.
Automatic plan is also inherited by the task’s descendants that do not have their own plan. In contrast to manual planning, however, this inheritance is interrupted whenever a descendant task is assigned to a resource other than its parent task from which it should inherit its automatic plan.
Recurrent tasks
In addition to standard one-time tasks, it is also possible to specify tasks repeated periodically. If you want to create a task to be repeated on a regular basis, select the New recurrent task option from the Record/New… menu.
A dialog window pops up where you can define the recurrent task in the two tabs, Definition and Recurrence.
In the Definition tab, you specify information like for a regular task, including thus its title, possibly a note explaining the nature of the task in more detail, the project where the task belongs, the parent task, the anticipated effort, and the task owner. The only specific feature as compared to a standard task is the definition of duration for every single task occurrence
The frequency and the time range within which the task will be repeated can be set in the Recurrence tab.
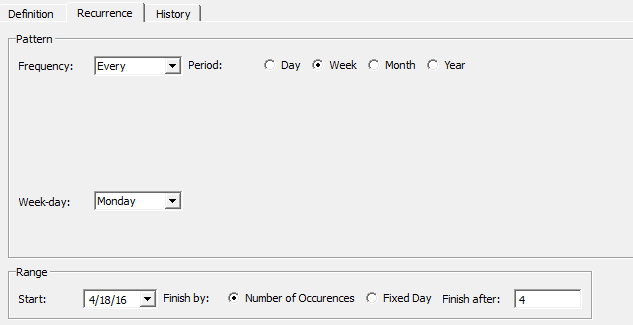
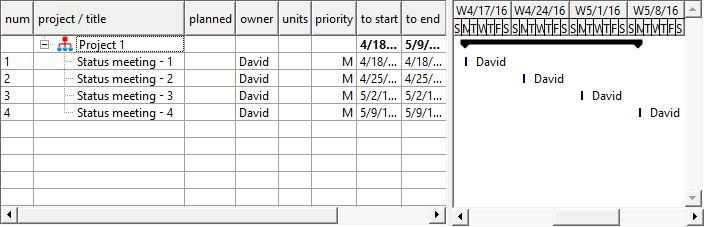
Based on the data entered, the application will generate a corresponding number of task occurrences. The title of these occurrences is then composed of the title of the recurrent task and the sequence number of the occurrence.
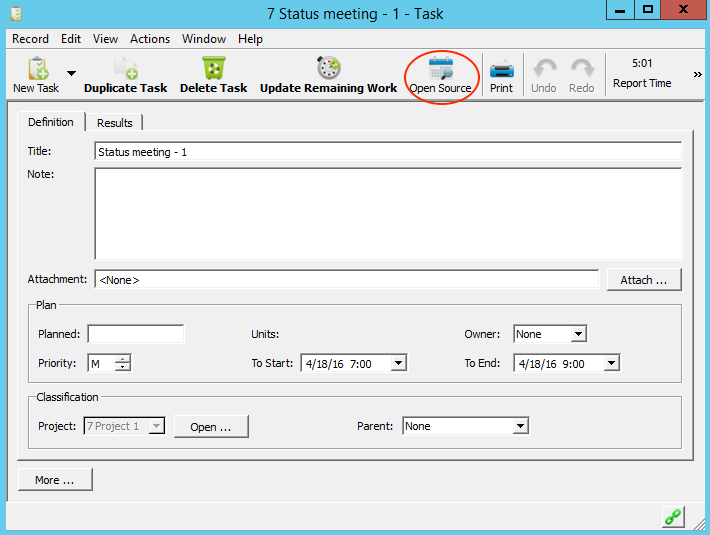
Individual occurrences are then treated as regular manually scheduled tasks; they can be freely modified, deleted, etc. The only restriction is that their title cannot be changed. The recurrence definition can be accessed from the individual task occurrences using the Record/Open Resource… menu (or the toolbar button of the same name) in the properties of the recurrent task.
The recurrence definition can be edited even after individual tasks have been generated. If you change the recurrence frequency, for example, individual task occurrences will be regenerated to correspond to the new recurrent task definition, which means that new occurrences may be added or old ones deleted.
Conflict resolution report
The Conflict Resolution report in the Tasks database enables you to get a precise idea of utilization for the individual resources across all projects and to resolve their possible overloading. It is split into two parts. The upper part contains an embedded report Plan by Resource and the lower one then contains the Utilization (of resources) report.
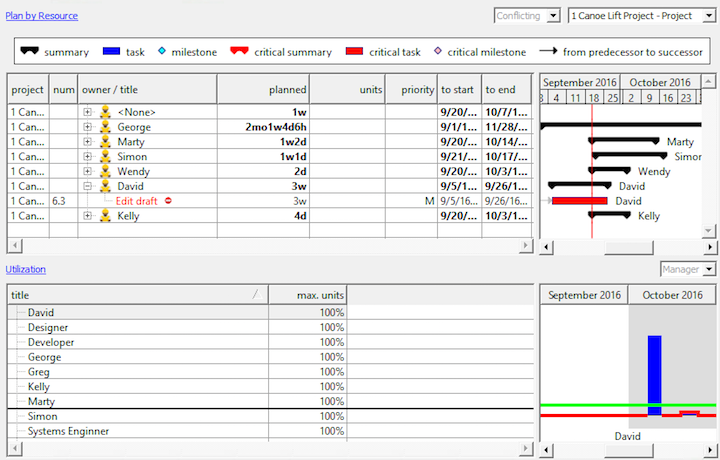
Plan by Resource serves to schedule resources across the projects. The individual scheduled tasks are grouped here according to the resources for the displayed period of time.
In addition to giving you a good idea of resource utilization, this report makes it possible to display easily what activities the resources should be working on during a particular time range.
The report also allows you to drag-and-drop tasks between the resources, making it easy to change task owners.
It is possible to filter this for conflicting records only (see subsection Conflicts in a schedule) and for records from a single project only.
The lower part of the Utilization report contains a graph of these values: Planned utilization, Peak utilization, and Max. Units for the individual days or other time intervals and for individual resources. It only shows data for projects whose manager is the active user.
Planned utilization is the scheduled work divided by the capacity and expressed as a percentage (the average value during a period).
Likewise, peak utilization is the scheduled work divided by the capacity and expressed as a percentage but it shows the maximum value during the displayed period. If, for instance, one resource has two tasks that overlap even for just a couple of minutes during the day (and their units are set to 100%) then the peak utilization of the resource for the given day will be 200% but the planned utilization is likely to be just a bit more than 100%.
The Max. Units value defines the percentage of the resource’s availability.
The chart is always shown for the currently selected row. If you select multiple rows then more charts are shown at the same time.
Utilization is initially displayed by days, and 100% thus means 8 hours on the given day. However, you can switch your view to utilization during an hour, week, month, quarter, as well as years. This you do via the View/Report/Modify/Zoom/… menu or using the local Zoom/… menu above the chart or else the Zoom in and Zoom out toolbar buttons.
Sometimes instead of a percentage, the chart displays infinity. This means the work is scheduled for Saturday or Sunday when the system assumes zero work capacity and it is impossible to calculate the ratio of the scheduled work to the zero capacity.
In addition to changing the zoom of the Value Line, you can also shift to the past and future using the Value Line. This is what the mouse-controllable scrollbar under the chart is used for. If you prefer the keyboard, use the following procedure:
- Go to the right part of the report (chart) using the <Ctrl+Tab> key combination.
- Move in time using the left and right keys.
The time line in these 2 reports is synchronized automatically for you to always see resource utilization as well as its tasks for the same period of time.
Attachments
Project manager as well as any project team member can use the task properties window and the Attach or Attach another button to attach an arbitrary number of files of up to 5 MB in the Attachment field.
Attachments associated with a particular task will be displayed in the Notes and attachments tab in the windows of those projects and subprojects under which the task is performed. The summary of notes and attachments and how to work with them is described in Chapter 4, section Notes and attachments.
Predecessors of a task
As already mentioned above, the schedule of any project is strongly based on the dependences between project activities. In Instant Team, these dependencies are represented by the predecessor-successor relations. Every such relation means that work on the task which is the successor in this relation cannot begin before its predecessor is completed. If a task has more predecessors, they all need to be completed.
The simplest way to add predecessor-successor relations to a project plan is to use mouse dragging in the Gantt chart, that is, in the right part of the Tasks report. Dragging here one of the tasks to another, you create a new relation—the task you dragged is the predecessor and its target task becomes the successor. The direction of dragging corresponds to the direction of the arrow, which is then displayed in the Gantt chart.
Another way of changing the predecessors and successors of a task is to use the Link toolbar button or the Actions menu with an option of the same name or possibly the <Ctrl+L> shortcut key. If you select 2 tasks and activate the Link action then the one higher up in the report becomes the predecessor of the one located lower in the report. Vice versa, if the selected tasks are already linked like this then the Link action disconnects the tasks. You can also use this action if you selected more than 2 tasks; in this case the selected tasks become concatenated one after another.

The predecessor-successor relations can also be set in the window containing the task which is the predecessor or successor in the given relation.
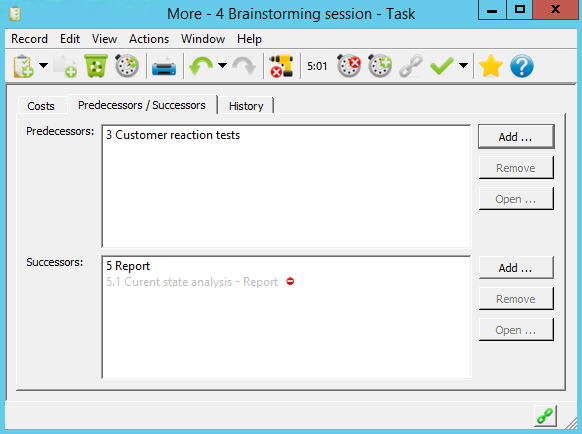
The Predecessors/Successors tab, available in the More sub-window shows you a list of all linked predecessors and successors. Using the Delete button, you can disconnect them and, naturally, using the Add… button, you can also add a predecessor and successor here.
There may be gray (hidden) arrows displayed in the Gantt chart in the following cases of linked tasks:
a) A predecessor or successor is in a collapsed part of a report but their counterpart is in the expanded part of the report (in this case the collapsed task is substituted by its nearest visible parent);
b) A predecessor or successor is not scheduled for any particular time (in that case the arrow starts or ends approximately half way through the project);
c) A predecessor or successor is not a part of the report at all; for instance, there is a filter set to a particular project but the task is in a different project (in that case only a horizontal arrow is displayed going nowhere or coming from nowhere);
d) A predecessor or successor is already completed and the predecessor-successor relation is thus not active and it is not taken into account when scheduling tasks.
Implicit predecessors
Besides predecessors that you set manually, the predecessor list in the task window also shows the so-called implicit predecessors that are added automatically by the system. These have the same impact on task scheduling as manually specified predecessors and are distinguished by gray color in the predecessor list. They arise as follows:
- If a task has a parent and this parent or some of its parents have predecessors then these predecessors become implicitly predecessors of this task as well.
- If there is a summary task—that is, a task with descendants—among predecessors then all descendants of such a predecessor become implicit predecessors.
Conflicts in a schedule
By adding predecessors to a project, you can very easily find yourself in a situation with a conflict arising within the schedule (as you can see, for instance, in Figure 5.5 where there is a conflicting task called Current state analysis). What is a conflict? Conflict is a situation when the project plan is unfeasible—or the system finds it that way at least.
These are sources of conflicts:
- A task or multiple tasks scheduled manually for more than 8 hours within a working day (or perhaps a task scheduled for a weekend).
- A task with an effort estimate but without an owner planned manually for any time.
- A scheduled task with a predecessor that has not been scheduled (its fields To Start/To End have not been set) and has a nonzero effort estimate.
- Cyclic dependency among predecessors.
- A task scheduled to begin before its predecessor is completed.
- A task that has been scheduled for a day when the resource is overloaded.
Conflicts within a schedule are indicated in more than one way:
- There is a red dot following the name of the conflicting task.
- The Conflicts column displays the digit 1 in case the task is in conflict with one or more other tasks.
The red dot is displayed for conflicting tasks in all reports and if you hover the mouse over it for a while, you will see details of the conflict. In this manner, you can also track conflicts, for example, in the Utilization report.
This is because the number of conflicts is summarized by projects so you can immediately see the total number of conflicts in the entire project.
Predecessor scheduling
You can set up a project plan in such a way that some of the conflicts mentioned above are automatically prevented. This is achieved using the so-called automatic task scheduling, described in subsection Project plan, and then also the so-called predecessor scheduling.
You can utilize this even if you still do not know or have not filled out yet how tasks are assigned to the individual resources. To apply it, you need to enter the value "P" in the Priority field for the given task. The system then automatically schedules the start and end times of such a task in such a way that it would start right after the scheduled end time of its predecessors and that it would end in accordance with the specified effort estimate (the Planned field) and the scheduled resource utilization (the Units field).
If the projected completion time of a predecessor of this task changes then this (subsequent) task is automatically rescheduled, too.
If a task has no incomplete predecessor and the value in the Priority field is P then its start time will be scheduled for the beginning of the working hours on the current workday. Setup options for the working hours are described in Chapter 3, section Calendars.
Successor scheduling
A task can also be scheduled for the latest possible time given its successors. If you enter the value "S" into the Priority field then the task is scheduled just before the scheduled beginning of its successors. If the task does not have a successor then the scheduling proceeds the same way as predecessor scheduling.
Tasks with a defined predecessor or successor are automatically switched to the successor scheduling mode (if they do not have a predecessor) or predecessor scheduling mode.
Critical path
After the tasks in a project are linked by predecessor-successor relations it is possible to analyze the critical path in the project.
The critical path is a sequence of follow-up tasks (critical tasks) in the project such that if they become delayed they will delay the completion of the entire project. But also conversely—by reducing the duration of a critical task, we can achieve a decrease in the duration of the whole project.
Therefore, critical path analysis is important to find ways of reducing the end time of a project and to identify the riskiest tasks for the project to succeed.
To analyze the critical path, you can use three fields that Instant Team calculates—Slack, Total Slack, and Critical—and the Critical Path report, which displays the values of these fields.
Slack is the amount of time that a task can slip without delaying the execution of any of its successors.
Total Slack is then the amount of time that a task can slip without delaying the completion of the last of its follow-up tasks, that is, typically the completion of the entire project. It is in fact the sum of slacks along the path from this task up to the last task of the project. It there are more such paths then the system considers the path with the smallest total slack.
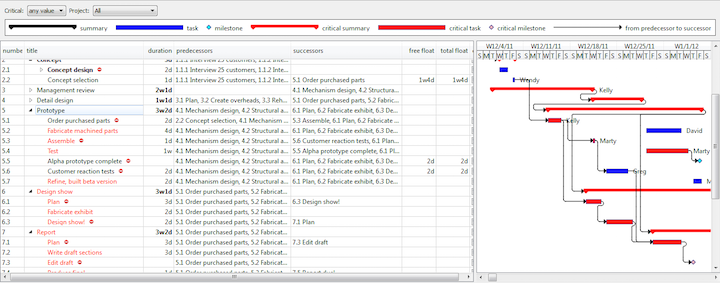
Tasks with zero total slack are then marked as critical—the Critical field is checked. Using the Critical parameter above the report, it is possible to filter critical tasks only.
The right part of the report shows a Gantt chart again but this time all critical tasks are highlighted in red.
Although it is not common it is possible to start a project with multiple end tasks in Instant Team. Instant Team simply considers all tasks that have a predecessor but no successor to be end tasks.
If there are more such tasks then also more critical paths appear in your project. However, every such a critical path can ultimately end at a different time and, most likely, only one of them will thus be really crucial for the project.
In such a situation, just add to the project one final task that will have all the original end tasks as its predecessors and Instant Team will recalculate the slacks and mark the critical path correctly.
60 days overview of all dates, capacities, inputs and outputs about each project and completely free.
All rights reserved, Created by eBRÁNA Privacy statement